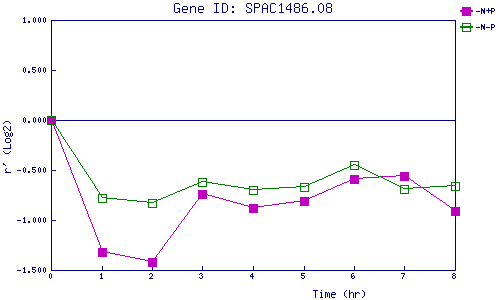
| 0 | 1 | 2 | 3 | 4 | 5 | 6 | 7 | 8 | |
| -N+P | 0.000 | -1.319 | -1.415 | -0.739 | -0.884 | -0.809 | -0.587 | -0.558 | -0.907 |
| -N-P | 0.000 | -0.782 | -0.834 | -0.618 | -0.699 | -0.671 | -0.449 | -0.691 | -0.661 |
|
-N+P: Nitrogen starved in the presence of P-factor -N-P: Nitrogen starved in the absence of P-factor |