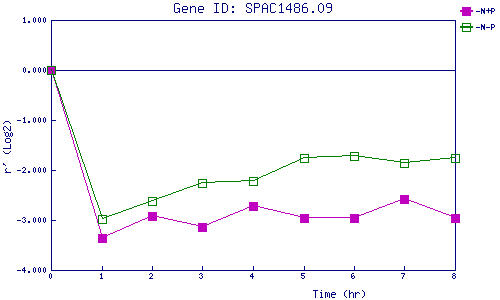
| 0 | 1 | 2 | 3 | 4 | 5 | 6 | 7 | 8 | |
| -N+P | 0.000 | -3.368 | -2.928 | -3.140 | -2.716 | -2.956 | -2.958 | -2.580 | -2.964 |
| -N-P | 0.000 | -2.989 | -2.615 | -2.265 | -2.217 | -1.760 | -1.717 | -1.864 | -1.766 |
|
-N+P: Nitrogen starved in the presence of P-factor -N-P: Nitrogen starved in the absence of P-factor |