spr18
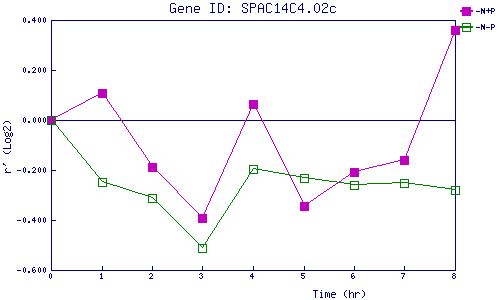
| 0 | 1 | 2 | 3 | 4 | 5 | 6 | 7 | 8 | |
| -N+P | 0.000 | 0.108 | -0.189 | -0.391 | 0.066 | -0.345 | -0.209 | -0.161 | 0.361 |
| -N-P | 0.000 | -0.249 | -0.314 | -0.511 | -0.196 | -0.233 | -0.259 | -0.251 | -0.279 |
|
-N+P: Nitrogen starved in the presence of P-factor -N-P: Nitrogen starved in the absence of P-factor |