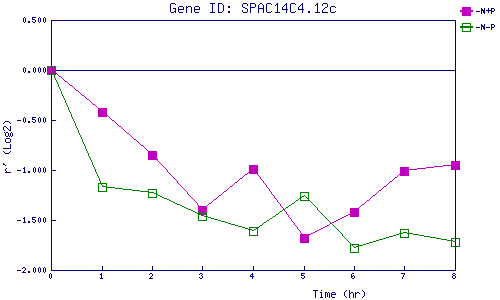
| 0 | 1 | 2 | 3 | 4 | 5 | 6 | 7 | 8 | |
| -N+P | 0.000 | -0.422 | -0.852 | -1.403 | -0.994 | -1.678 | -1.418 | -1.011 | -0.951 |
| -N-P | 0.000 | -1.167 | -1.232 | -1.460 | -1.608 | -1.261 | -1.785 | -1.628 | -1.720 |
|
-N+P: Nitrogen starved in the presence of P-factor -N-P: Nitrogen starved in the absence of P-factor |