rad17
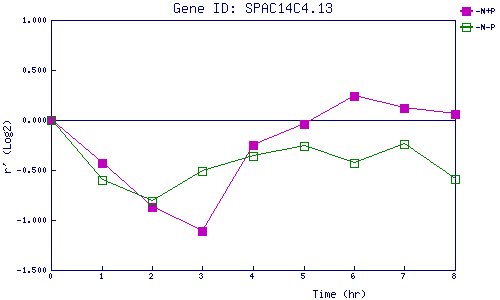
| 0 | 1 | 2 | 3 | 4 | 5 | 6 | 7 | 8 | |
| -N+P | 0.000 | -0.430 | -0.868 | -1.107 | -0.246 | -0.039 | 0.238 | 0.124 | 0.056 |
| -N-P | 0.000 | -0.602 | -0.806 | -0.510 | -0.362 | -0.255 | -0.431 | -0.239 | -0.591 |
|
-N+P: Nitrogen starved in the presence of P-factor -N-P: Nitrogen starved in the absence of P-factor |