| 0 | 1 | 2 | 3 | 4 | 5 | 6 | 7 | 8 | |
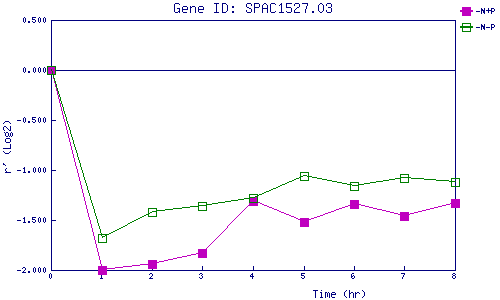
| -N+P | 0.000 | -1.997 | -1.943 | -1.833 | -1.307 | -1.525 | -1.345 | -1.459 | -1.334 |
| -N-P | 0.000 | -1.675 | -1.425 | -1.361 | -1.278 | -1.057 | -1.155 | -1.076 | -1.116 |
|
-N+P: Nitrogen starved in the presence of P-factor -N-P: Nitrogen starved in the absence of P-factor |