azr1
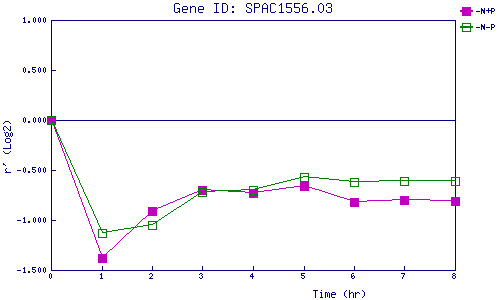
| 0 | 1 | 2 | 3 | 4 | 5 | 6 | 7 | 8 | |
| -N+P | 0.000 | -1.381 | -0.906 | -0.698 | -0.733 | -0.665 | -0.823 | -0.796 | -0.813 |
| -N-P | 0.000 | -1.130 | -1.050 | -0.722 | -0.701 | -0.569 | -0.623 | -0.609 | -0.613 |
|
-N+P: Nitrogen starved in the presence of P-factor -N-P: Nitrogen starved in the absence of P-factor |