| 0 | 1 | 2 | 3 | 4 | 5 | 6 | 7 | 8 | |
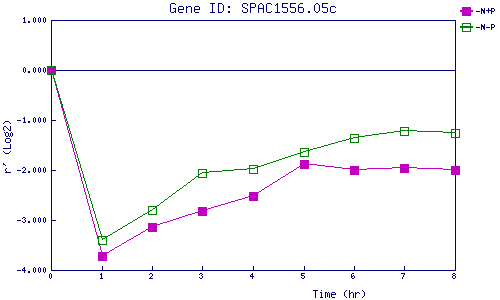
| -N+P | 0.000 | -3.718 | -3.140 | -2.822 | -2.528 | -1.890 | -1.998 | -1.962 | -1.997 |
| -N-P | 0.000 | -3.397 | -2.798 | -2.069 | -1.977 | -1.639 | -1.356 | -1.213 | -1.251 |
|
-N+P: Nitrogen starved in the presence of P-factor -N-P: Nitrogen starved in the absence of P-factor |