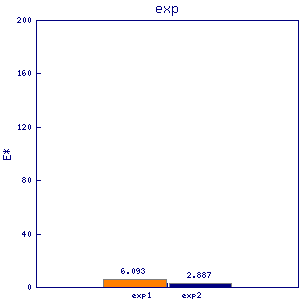
meu1
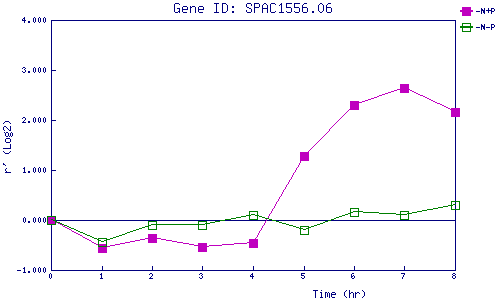
| 0 | 1 | 2 | 3 | 4 | 5 | 6 | 7 | 8 | |
| -N+P | 0.000 | -0.557 | -0.356 | -0.547 | -0.454 | 1.284 | 2.298 | 2.646 | 2.151 |
| -N-P | 0.000 | -0.441 | -0.109 | -0.093 | 0.102 | -0.202 | 0.153 | 0.103 | 0.296 |
|
-N+P: Nitrogen starved in the presence of P-factor -N-P: Nitrogen starved in the absence of P-factor |