pmm1
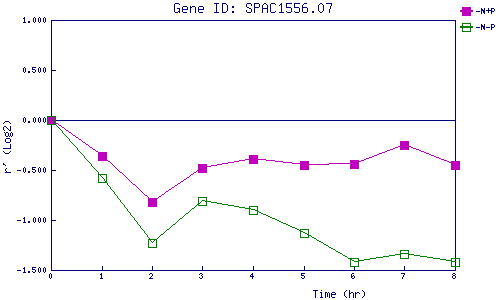
| 0 | 1 | 2 | 3 | 4 | 5 | 6 | 7 | 8 | |
| -N+P | 0.000 | -0.364 | -0.816 | -0.485 | -0.386 | -0.454 | -0.436 | -0.250 | -0.448 |
| -N-P | 0.000 | -0.578 | -1.231 | -0.810 | -0.905 | -1.126 | -1.417 | -1.342 | -1.423 |
|
-N+P: Nitrogen starved in the presence of P-factor -N-P: Nitrogen starved in the absence of P-factor |