| 0 | 1 | 2 | 3 | 4 | 5 | 6 | 7 | 8 | |
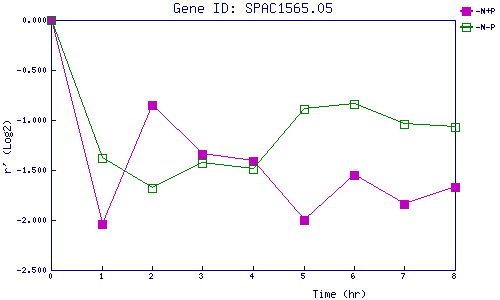
| -N+P | 0.000 | -2.040 | -0.853 | -1.344 | -1.408 | -1.997 | -1.549 | -1.842 | -1.668 |
| -N-P | 0.000 | -1.379 | -1.681 | -1.431 | -1.486 | -0.887 | -0.840 | -1.035 | -1.073 |
|
-N+P: Nitrogen starved in the presence of P-factor -N-P: Nitrogen starved in the absence of P-factor |