sid3 spg1
| 0 | 1 | 2 | 3 | 4 | 5 | 6 | 7 | 8 | |
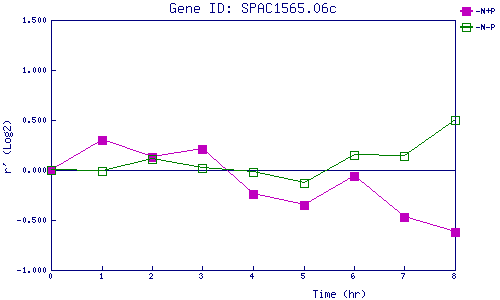
| -N+P | 0.000 | 0.299 | 0.132 | 0.208 | -0.239 | -0.351 | -0.055 | -0.468 | -0.620 |
| -N-P | 0.000 | -0.006 | 0.113 | 0.020 | -0.018 | -0.132 | 0.152 | 0.143 | 0.503 |
|
-N+P: Nitrogen starved in the presence of P-factor -N-P: Nitrogen starved in the absence of P-factor |