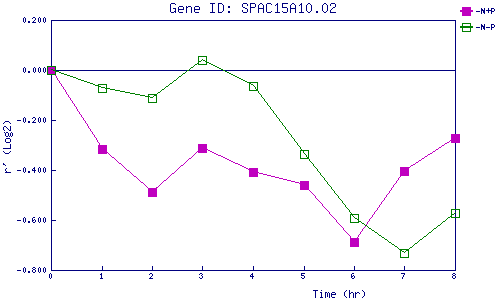
| 0 | 1 | 2 | 3 | 4 | 5 | 6 | 7 | 8 | |
| -N+P | 0.000 | -0.317 | -0.490 | -0.313 | -0.409 | -0.461 | -0.690 | -0.405 | -0.274 |
| -N-P | 0.000 | -0.073 | -0.112 | 0.038 | -0.064 | -0.337 | -0.593 | -0.733 | -0.571 |
|
-N+P: Nitrogen starved in the presence of P-factor -N-P: Nitrogen starved in the absence of P-factor |