zpr1
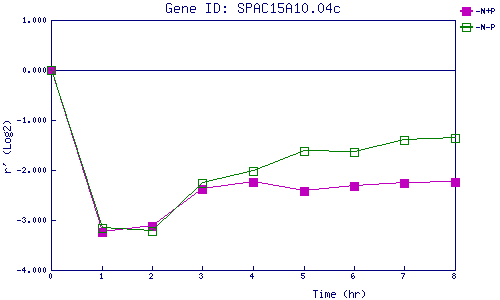
| 0 | 1 | 2 | 3 | 4 | 5 | 6 | 7 | 8 | |
| -N+P | 0.000 | -3.233 | -3.120 | -2.373 | -2.233 | -2.413 | -2.311 | -2.268 | -2.242 |
| -N-P | 0.000 | -3.151 | -3.224 | -2.268 | -2.019 | -1.614 | -1.634 | -1.402 | -1.355 |
|
-N+P: Nitrogen starved in the presence of P-factor -N-P: Nitrogen starved in the absence of P-factor |