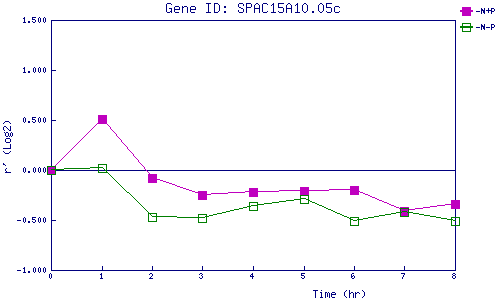
| 0 | 1 | 2 | 3 | 4 | 5 | 6 | 7 | 8 | |
| -N+P | 0.000 | 0.512 | -0.081 | -0.253 | -0.220 | -0.206 | -0.201 | -0.406 | -0.341 |
| -N-P | 0.000 | 0.020 | -0.466 | -0.478 | -0.361 | -0.289 | -0.512 | -0.422 | -0.514 |
|
-N+P: Nitrogen starved in the presence of P-factor -N-P: Nitrogen starved in the absence of P-factor |