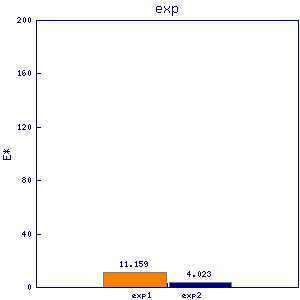
ain1
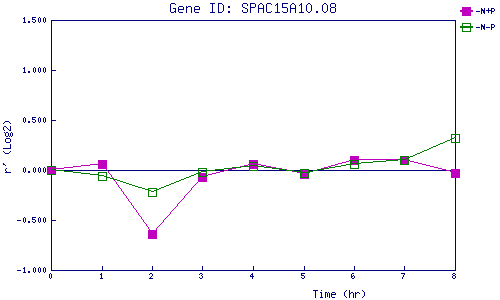
| 0 | 1 | 2 | 3 | 4 | 5 | 6 | 7 | 8 | |
| -N+P | 0.000 | 0.058 | -0.644 | -0.066 | 0.064 | -0.045 | 0.105 | 0.101 | -0.031 |
| -N-P | 0.000 | -0.062 | -0.220 | -0.024 | 0.043 | -0.033 | 0.065 | 0.103 | 0.321 |
|
-N+P: Nitrogen starved in the presence of P-factor -N-P: Nitrogen starved in the absence of P-factor |