mde6 meu16
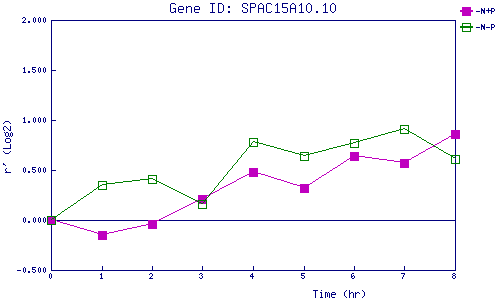
| 0 | 1 | 2 | 3 | 4 | 5 | 6 | 7 | 8 | |
| -N+P | 0.000 | -0.152 | -0.040 | 0.207 | 0.480 | 0.325 | 0.640 | 0.572 | 0.858 |
| -N-P | 0.000 | 0.347 | 0.409 | 0.164 | 0.781 | 0.637 | 0.771 | 0.906 | 0.608 |
|
-N+P: Nitrogen starved in the presence of P-factor -N-P: Nitrogen starved in the absence of P-factor |