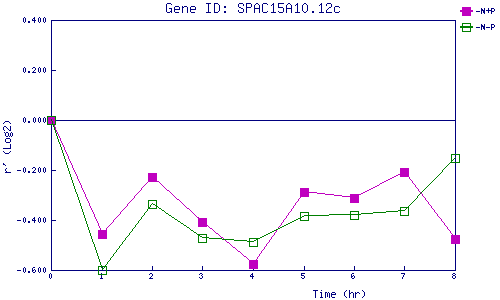
| 0 | 1 | 2 | 3 | 4 | 5 | 6 | 7 | 8 | |
| -N+P | 0.000 | -0.458 | -0.229 | -0.410 | -0.577 | -0.290 | -0.311 | -0.209 | -0.475 |
| -N-P | 0.000 | -0.599 | -0.335 | -0.474 | -0.487 | -0.386 | -0.381 | -0.363 | -0.154 |
|
-N+P: Nitrogen starved in the presence of P-factor -N-P: Nitrogen starved in the absence of P-factor |