rpl36a
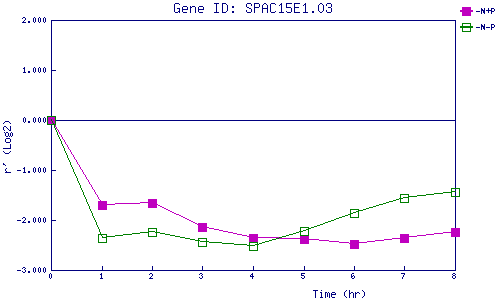
| 0 | 1 | 2 | 3 | 4 | 5 | 6 | 7 | 8 | |
| -N+P | 0.000 | -1.704 | -1.659 | -2.146 | -2.358 | -2.381 | -2.479 | -2.355 | -2.236 |
| -N-P | 0.000 | -2.357 | -2.237 | -2.446 | -2.526 | -2.212 | -1.855 | -1.551 | -1.439 |
|
-N+P: Nitrogen starved in the presence of P-factor -N-P: Nitrogen starved in the absence of P-factor |