vps29
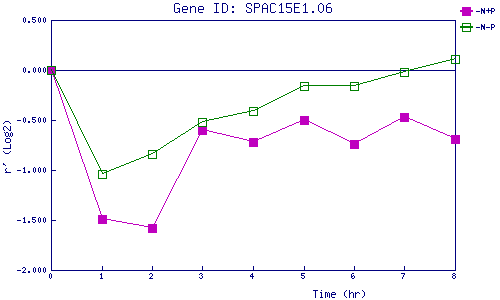
| 0 | 1 | 2 | 3 | 4 | 5 | 6 | 7 | 8 | |
| -N+P | 0.000 | -1.490 | -1.583 | -0.605 | -0.725 | -0.503 | -0.741 | -0.468 | -0.687 |
| -N-P | 0.000 | -1.038 | -0.842 | -0.518 | -0.411 | -0.165 | -0.159 | -0.017 | 0.110 |
|
-N+P: Nitrogen starved in the presence of P-factor -N-P: Nitrogen starved in the absence of P-factor |