| 0 | 1 | 2 | 3 | 4 | 5 | 6 | 7 | 8 | |
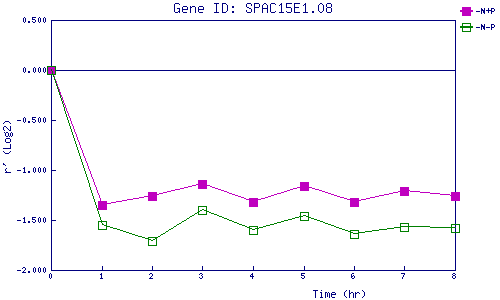
| -N+P | 0.000 | -1.349 | -1.264 | -1.145 | -1.321 | -1.156 | -1.324 | -1.211 | -1.263 |
| -N-P | 0.000 | -1.554 | -1.711 | -1.397 | -1.605 | -1.463 | -1.635 | -1.569 | -1.579 |
|
-N+P: Nitrogen starved in the presence of P-factor -N-P: Nitrogen starved in the absence of P-factor |