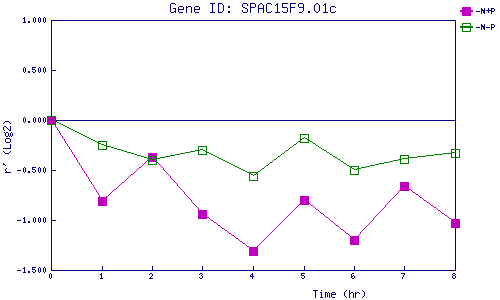
| 0 | 1 | 2 | 3 | 4 | 5 | 6 | 7 | 8 | |
| -N+P | 0.000 | -0.809 | -0.372 | -0.936 | -1.313 | -0.796 | -1.204 | -0.664 | -1.033 |
| -N-P | 0.000 | -0.251 | -0.401 | -0.302 | -0.565 | -0.178 | -0.505 | -0.386 | -0.334 |
|
-N+P: Nitrogen starved in the presence of P-factor -N-P: Nitrogen starved in the absence of P-factor |