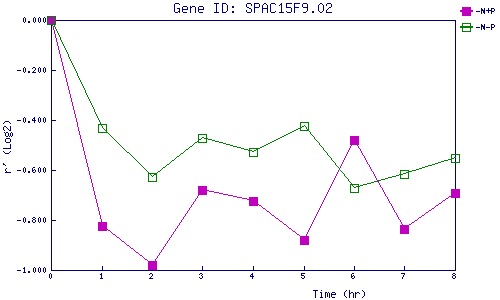
| 0 | 1 | 2 | 3 | 4 | 5 | 6 | 7 | 8 | |
| -N+P | 0.000 | -0.826 | -0.980 | -0.678 | -0.725 | -0.882 | -0.480 | -0.837 | -0.693 |
| -N-P | 0.000 | -0.430 | -0.627 | -0.473 | -0.530 | -0.423 | -0.670 | -0.614 | -0.550 |
|
-N+P: Nitrogen starved in the presence of P-factor -N-P: Nitrogen starved in the absence of P-factor |