rho2
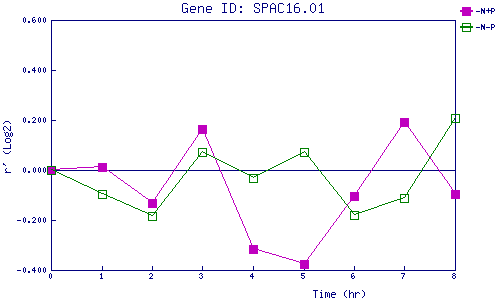
| 0 | 1 | 2 | 3 | 4 | 5 | 6 | 7 | 8 | |
| -N+P | 0.000 | 0.012 | -0.132 | 0.163 | -0.316 | -0.374 | -0.103 | 0.191 | -0.097 |
| -N-P | 0.000 | -0.095 | -0.183 | 0.072 | -0.030 | 0.073 | -0.181 | -0.112 | 0.209 |
|
-N+P: Nitrogen starved in the presence of P-factor -N-P: Nitrogen starved in the absence of P-factor |