srp2
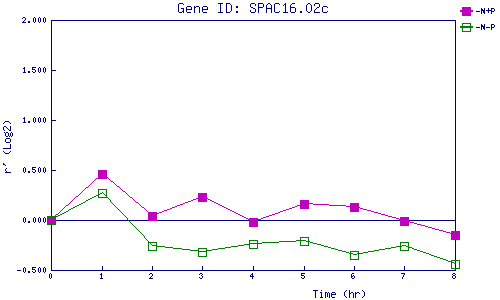
| 0 | 1 | 2 | 3 | 4 | 5 | 6 | 7 | 8 | |
| -N+P | 0.000 | 0.459 | 0.041 | 0.232 | -0.021 | 0.158 | 0.133 | -0.008 | -0.149 |
| -N-P | 0.000 | 0.266 | -0.259 | -0.316 | -0.242 | -0.206 | -0.350 | -0.262 | -0.439 |
|
-N+P: Nitrogen starved in the presence of P-factor -N-P: Nitrogen starved in the absence of P-factor |