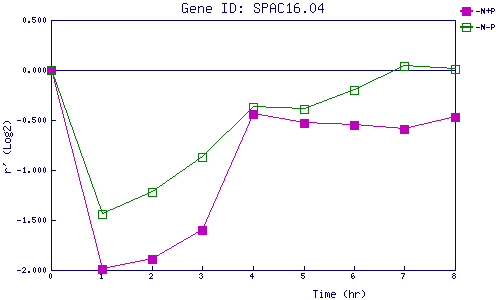
| 0 | 1 | 2 | 3 | 4 | 5 | 6 | 7 | 8 | |
| -N+P | 0.000 | -1.993 | -1.887 | -1.600 | -0.435 | -0.528 | -0.553 | -0.593 | -0.473 |
| -N-P | 0.000 | -1.436 | -1.220 | -0.868 | -0.367 | -0.386 | -0.197 | 0.040 | 0.008 |
|
-N+P: Nitrogen starved in the presence of P-factor -N-P: Nitrogen starved in the absence of P-factor |