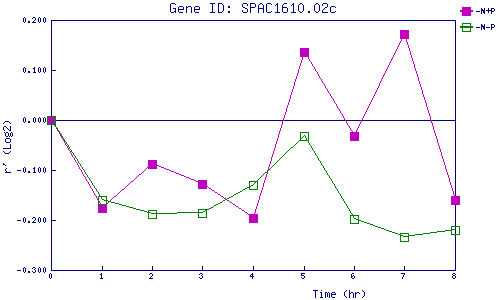
| 0 | 1 | 2 | 3 | 4 | 5 | 6 | 7 | 8 | |
| -N+P | 0.000 | -0.175 | -0.089 | -0.129 | -0.197 | 0.135 | -0.033 | 0.171 | -0.159 |
| -N-P | 0.000 | -0.160 | -0.187 | -0.186 | -0.130 | -0.032 | -0.198 | -0.234 | -0.221 |
|
-N+P: Nitrogen starved in the presence of P-factor -N-P: Nitrogen starved in the absence of P-factor |