crp79 meu5
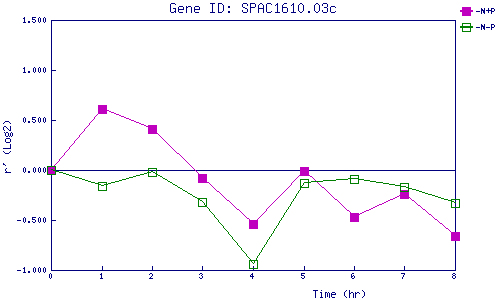
| 0 | 1 | 2 | 3 | 4 | 5 | 6 | 7 | 8 | |
| -N+P | 0.000 | 0.607 | 0.413 | -0.082 | -0.539 | -0.006 | -0.469 | -0.241 | -0.661 |
| -N-P | 0.000 | -0.164 | -0.016 | -0.316 | -0.935 | -0.129 | -0.092 | -0.171 | -0.333 |
|
-N+P: Nitrogen starved in the presence of P-factor -N-P: Nitrogen starved in the absence of P-factor |