snu66
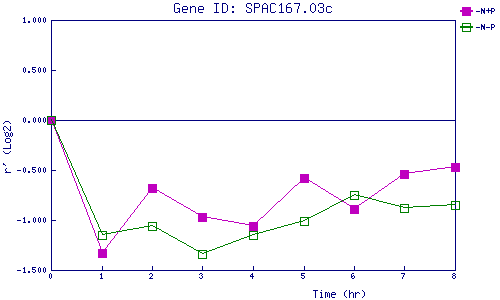
| 0 | 1 | 2 | 3 | 4 | 5 | 6 | 7 | 8 | |
| -N+P | 0.000 | -1.328 | -0.684 | -0.967 | -1.062 | -0.583 | -0.890 | -0.539 | -0.469 |
| -N-P | 0.000 | -1.147 | -1.056 | -1.336 | -1.147 | -1.014 | -0.746 | -0.884 | -0.847 |
|
-N+P: Nitrogen starved in the presence of P-factor -N-P: Nitrogen starved in the absence of P-factor |