| 0 | 1 | 2 | 3 | 4 | 5 | 6 | 7 | 8 | |
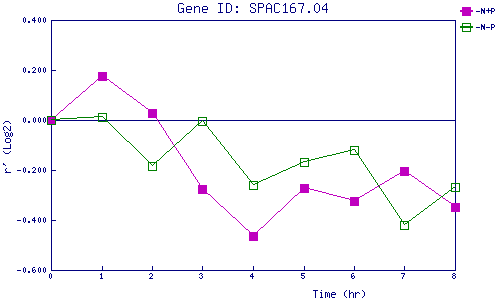
| -N+P | 0.000 | 0.178 | 0.028 | -0.277 | -0.466 | -0.270 | -0.325 | -0.203 | -0.348 |
| -N-P | 0.000 | 0.012 | -0.182 | -0.003 | -0.260 | -0.167 | -0.121 | -0.419 | -0.268 |
|
-N+P: Nitrogen starved in the presence of P-factor -N-P: Nitrogen starved in the absence of P-factor |