rpc19 rpa17
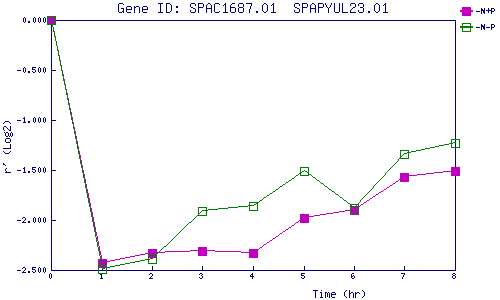
| 0 | 1 | 2 | 3 | 4 | 5 | 6 | 7 | 8 | |
| -N+P | 0.000 | -2.434 | -2.331 | -2.308 | -2.328 | -1.976 | -1.895 | -1.567 | -1.506 |
| -N-P | 0.000 | -2.488 | -2.391 | -1.908 | -1.858 | -1.512 | -1.876 | -1.335 | -1.233 |
|
-N+P: Nitrogen starved in the presence of P-factor -N-P: Nitrogen starved in the absence of P-factor |