rfc4
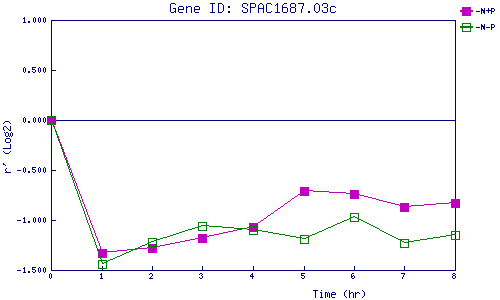
| 0 | 1 | 2 | 3 | 4 | 5 | 6 | 7 | 8 | |
| -N+P | 0.000 | -1.331 | -1.275 | -1.180 | -1.074 | -0.712 | -0.743 | -0.874 | -0.830 |
| -N-P | 0.000 | -1.437 | -1.221 | -1.065 | -1.099 | -1.187 | -0.973 | -1.227 | -1.146 |
|
-N+P: Nitrogen starved in the presence of P-factor -N-P: Nitrogen starved in the absence of P-factor |