reserved_name_pli1
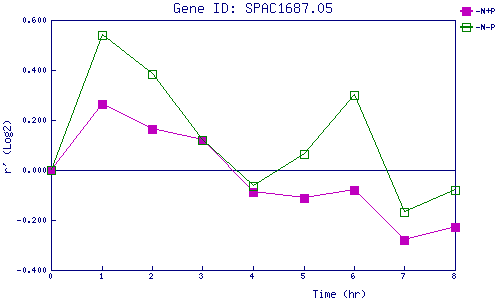
| 0 | 1 | 2 | 3 | 4 | 5 | 6 | 7 | 8 | |
| -N+P | 0.000 | 0.263 | 0.165 | 0.120 | -0.088 | -0.113 | -0.081 | -0.279 | -0.227 |
| -N-P | 0.000 | 0.539 | 0.385 | 0.121 | -0.065 | 0.062 | 0.300 | -0.170 | -0.082 |
|
-N+P: Nitrogen starved in the presence of P-factor -N-P: Nitrogen starved in the absence of P-factor |