rpl28 rpl44
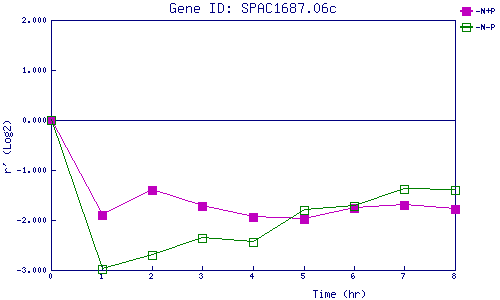
| 0 | 1 | 2 | 3 | 4 | 5 | 6 | 7 | 8 | |
| -N+P | 0.000 | -1.893 | -1.401 | -1.718 | -1.932 | -1.974 | -1.770 | -1.704 | -1.781 |
| -N-P | 0.000 | -2.977 | -2.693 | -2.353 | -2.441 | -1.806 | -1.715 | -1.379 | -1.400 |
|
-N+P: Nitrogen starved in the presence of P-factor -N-P: Nitrogen starved in the absence of P-factor |