pmt2
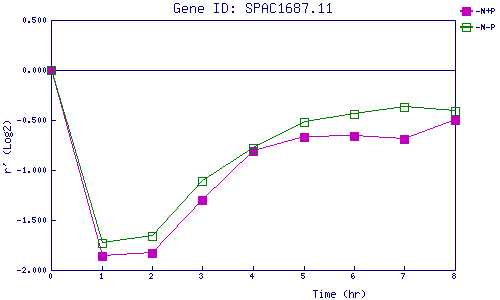
| 0 | 1 | 2 | 3 | 4 | 5 | 6 | 7 | 8 | |
| -N+P | 0.000 | -1.859 | -1.828 | -1.300 | -0.809 | -0.670 | -0.665 | -0.691 | -0.505 |
| -N-P | 0.000 | -1.734 | -1.660 | -1.110 | -0.783 | -0.517 | -0.443 | -0.371 | -0.413 |
|
-N+P: Nitrogen starved in the presence of P-factor -N-P: Nitrogen starved in the absence of P-factor |