coq4
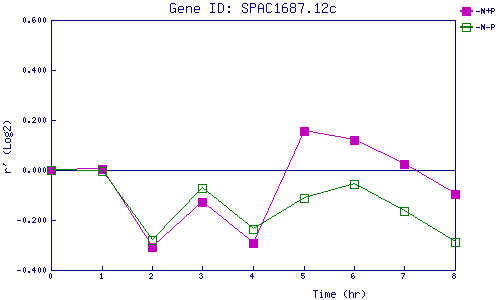
| 0 | 1 | 2 | 3 | 4 | 5 | 6 | 7 | 8 | |
| -N+P | 0.000 | 0.003 | -0.309 | -0.129 | -0.291 | 0.156 | 0.122 | 0.026 | -0.096 |
| -N-P | 0.000 | -0.005 | -0.279 | -0.071 | -0.235 | -0.113 | -0.056 | -0.164 | -0.288 |
|
-N+P: Nitrogen starved in the presence of P-factor -N-P: Nitrogen starved in the absence of P-factor |