csn5
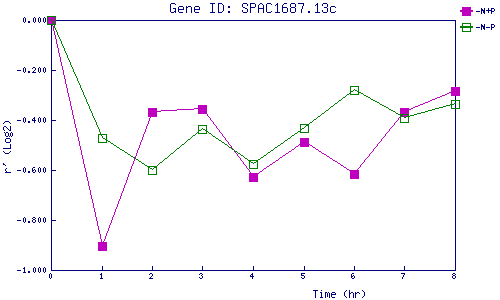
| 0 | 1 | 2 | 3 | 4 | 5 | 6 | 7 | 8 | |
| -N+P | 0.000 | -0.906 | -0.367 | -0.357 | -0.629 | -0.490 | -0.616 | -0.369 | -0.283 |
| -N-P | 0.000 | -0.473 | -0.601 | -0.437 | -0.577 | -0.434 | -0.278 | -0.390 | -0.335 |
|
-N+P: Nitrogen starved in the presence of P-factor -N-P: Nitrogen starved in the absence of P-factor |