| 0 | 1 | 2 | 3 | 4 | 5 | 6 | 7 | 8 | |
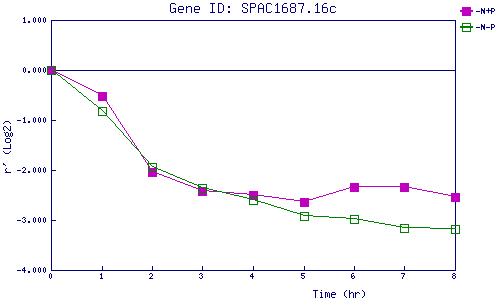
| -N+P | 0.000 | -0.516 | -2.031 | -2.419 | -2.499 | -2.638 | -2.336 | -2.332 | -2.544 |
| -N-P | 0.000 | -0.822 | -1.938 | -2.358 | -2.603 | -2.920 | -2.986 | -3.163 | -3.179 |
|
-N+P: Nitrogen starved in the presence of P-factor -N-P: Nitrogen starved in the absence of P-factor |