| 0 | 1 | 2 | 3 | 4 | 5 | 6 | 7 | 8 | |
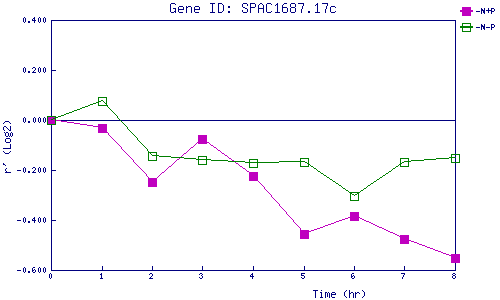
| -N+P | 0.000 | -0.032 | -0.246 | -0.075 | -0.222 | -0.457 | -0.384 | -0.476 | -0.552 |
| -N-P | 0.000 | 0.077 | -0.144 | -0.161 | -0.171 | -0.168 | -0.306 | -0.170 | -0.153 |
|
-N+P: Nitrogen starved in the presence of P-factor -N-P: Nitrogen starved in the absence of P-factor |