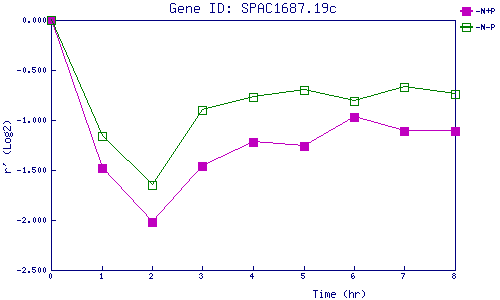
| 0 | 1 | 2 | 3 | 4 | 5 | 6 | 7 | 8 | |
| -N+P | 0.000 | -1.476 | -2.015 | -1.463 | -1.215 | -1.264 | -0.967 | -1.109 | -1.113 |
| -N-P | 0.000 | -1.165 | -1.652 | -0.897 | -0.772 | -0.699 | -0.806 | -0.668 | -0.742 |
|
-N+P: Nitrogen starved in the presence of P-factor -N-P: Nitrogen starved in the absence of P-factor |