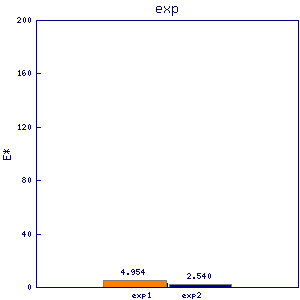
mis6
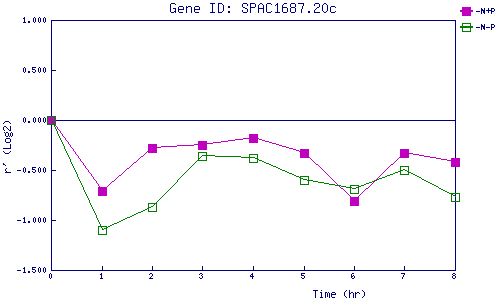
| 0 | 1 | 2 | 3 | 4 | 5 | 6 | 7 | 8 | |
| -N+P | 0.000 | -0.711 | -0.279 | -0.248 | -0.184 | -0.334 | -0.814 | -0.330 | -0.424 |
| -N-P | 0.000 | -1.101 | -0.871 | -0.362 | -0.385 | -0.595 | -0.692 | -0.499 | -0.774 |
|
-N+P: Nitrogen starved in the presence of P-factor -N-P: Nitrogen starved in the absence of P-factor |