| 0 | 1 | 2 | 3 | 4 | 5 | 6 | 7 | 8 | |
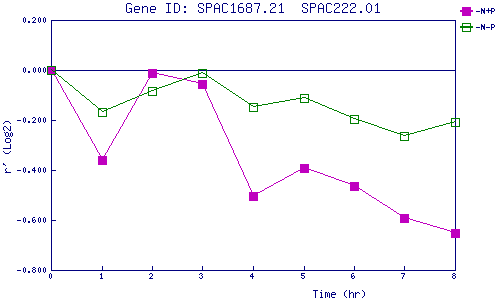
| -N+P | 0.000 | -0.359 | -0.013 | -0.056 | -0.503 | -0.394 | -0.464 | -0.591 | -0.651 |
| -N-P | 0.000 | -0.169 | -0.083 | -0.013 | -0.149 | -0.114 | -0.197 | -0.265 | -0.206 |
|
-N+P: Nitrogen starved in the presence of P-factor -N-P: Nitrogen starved in the absence of P-factor |