| 0 | 1 | 2 | 3 | 4 | 5 | 6 | 7 | 8 | |
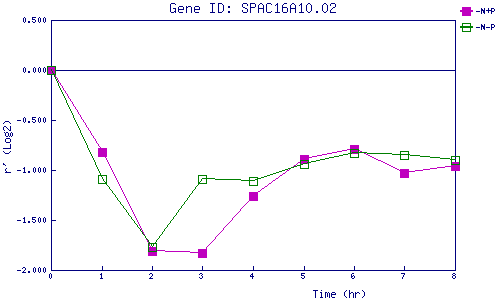
| -N+P | 0.000 | -0.817 | -1.813 | -1.827 | -1.257 | -0.893 | -0.789 | -1.032 | -0.957 |
| -N-P | 0.000 | -1.089 | -1.768 | -1.094 | -1.112 | -0.937 | -0.832 | -0.848 | -0.903 |
|
-N+P: Nitrogen starved in the presence of P-factor -N-P: Nitrogen starved in the absence of P-factor |