pep5 vps11
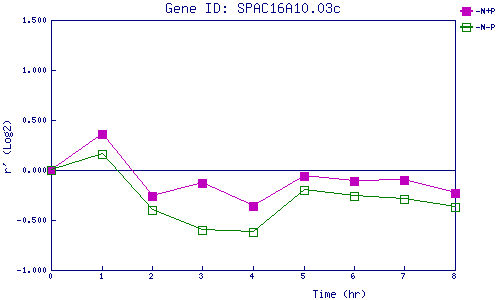
| 0 | 1 | 2 | 3 | 4 | 5 | 6 | 7 | 8 | |
| -N+P | 0.000 | 0.364 | -0.257 | -0.133 | -0.360 | -0.056 | -0.107 | -0.098 | -0.234 |
| -N-P | 0.000 | 0.160 | -0.397 | -0.604 | -0.619 | -0.201 | -0.260 | -0.286 | -0.369 |
|
-N+P: Nitrogen starved in the presence of P-factor -N-P: Nitrogen starved in the absence of P-factor |