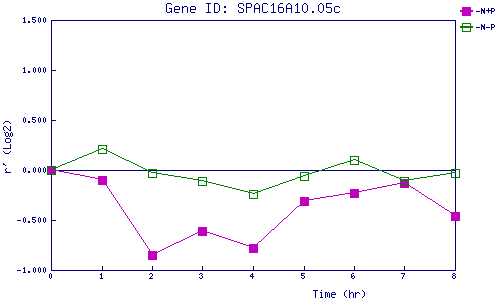
| 0 | 1 | 2 | 3 | 4 | 5 | 6 | 7 | 8 | |
| -N+P | 0.000 | -0.097 | -0.848 | -0.608 | -0.777 | -0.314 | -0.232 | -0.127 | -0.455 |
| -N-P | 0.000 | 0.213 | -0.031 | -0.114 | -0.235 | -0.058 | 0.100 | -0.114 | -0.029 |
|
-N+P: Nitrogen starved in the presence of P-factor -N-P: Nitrogen starved in the absence of P-factor |