myb1 taz1 myb
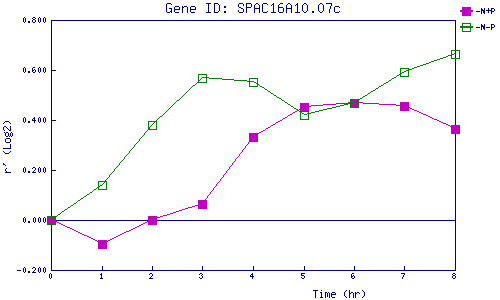
| 0 | 1 | 2 | 3 | 4 | 5 | 6 | 7 | 8 | |
| -N+P | 0.000 | -0.094 | -0.001 | 0.066 | 0.332 | 0.451 | 0.469 | 0.458 | 0.365 |
| -N-P | 0.000 | 0.139 | 0.379 | 0.570 | 0.553 | 0.420 | 0.469 | 0.590 | 0.665 |
|
-N+P: Nitrogen starved in the presence of P-factor -N-P: Nitrogen starved in the absence of P-factor |