| 0 | 1 | 2 | 3 | 4 | 5 | 6 | 7 | 8 | |
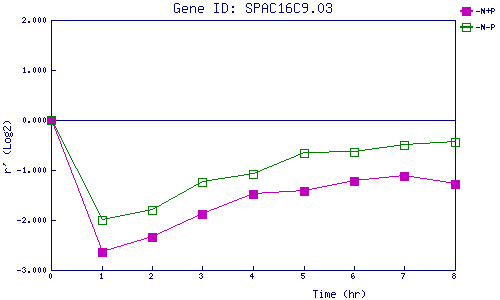
| -N+P | 0.000 | -2.649 | -2.336 | -1.881 | -1.478 | -1.426 | -1.215 | -1.112 | -1.273 |
| -N-P | 0.000 | -1.993 | -1.805 | -1.247 | -1.089 | -0.660 | -0.648 | -0.495 | -0.450 |
|
-N+P: Nitrogen starved in the presence of P-factor -N-P: Nitrogen starved in the absence of P-factor |