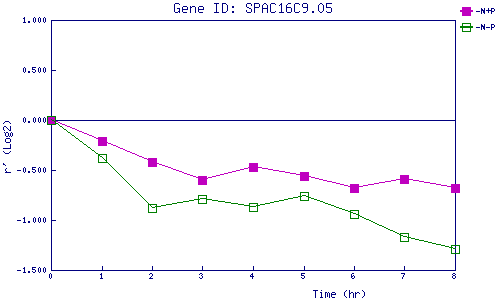
| 0 | 1 | 2 | 3 | 4 | 5 | 6 | 7 | 8 | |
| -N+P | 0.000 | -0.213 | -0.418 | -0.604 | -0.473 | -0.564 | -0.682 | -0.587 | -0.677 |
| -N-P | 0.000 | -0.381 | -0.875 | -0.791 | -0.871 | -0.757 | -0.935 | -1.173 | -1.288 |
|
-N+P: Nitrogen starved in the presence of P-factor -N-P: Nitrogen starved in the absence of P-factor |