mde1
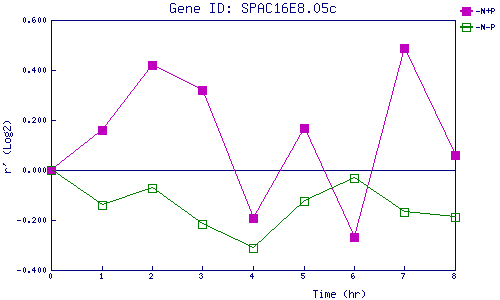
| 0 | 1 | 2 | 3 | 4 | 5 | 6 | 7 | 8 | |
| -N+P | 0.000 | 0.162 | 0.419 | 0.319 | -0.193 | 0.169 | -0.269 | 0.489 | 0.061 |
| -N-P | 0.000 | -0.141 | -0.071 | -0.214 | -0.311 | -0.123 | -0.031 | -0.169 | -0.187 |
|
-N+P: Nitrogen starved in the presence of P-factor -N-P: Nitrogen starved in the absence of P-factor |