| 0 | 1 | 2 | 3 | 4 | 5 | 6 | 7 | 8 | |
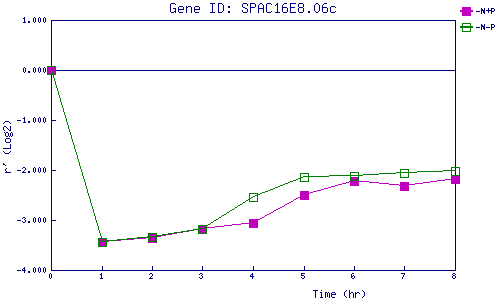
| -N+P | 0.000 | -3.447 | -3.362 | -3.173 | -3.052 | -2.503 | -2.227 | -2.327 | -2.178 |
| -N-P | 0.000 | -3.442 | -3.338 | -3.186 | -2.543 | -2.131 | -2.116 | -2.057 | -2.028 |
|
-N+P: Nitrogen starved in the presence of P-factor -N-P: Nitrogen starved in the absence of P-factor |